
Sargent Jump Test
Testing and measurement are the means of collecting information upon which subsequent performance evaluations and decisions are made. In the analysis, we need to consider factors influencing the results.
The Sargent Jump Test (Sargent 1921)[7], also known as the vertical jump test, was developed by Dr Dudley Allen Sargent (1849-1924).
Objective
To monitor the development of the athlete's elastic leg strength.
Required Resources
To conduct this test, you will require:
- Wall
- Tape measure
- Step Ladder
- Chalk
- Assistant
How to conduct the test
- The athlete warms up for 10 minutes
- The athlete chalks the end of their fingertips
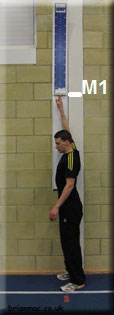
- The athlete stands side onto the wall, keeping both feet remaining on the ground, reaches up as high as possible with one hand and marks the wall with the tips of the fingers (M1)
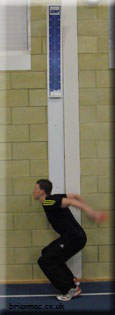
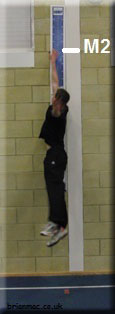
- From a static position, the athlete jumps as high as possible and marks the wall with the chalk on his fingers (M2).
- The assistant measures and records the distance between M1 and M2
- The athlete repeats the test 3 times
- The assistant calculates the average of the recorded distances and uses this value to assess the athlete's performance
 |
 |
 |
Assessment
The following normative data is available for this test.
The following normative data, adapted from Chu (1996)[4], is for world-class athletes.
| Gender | Excellent | Above average | Average | Below average | Poor |
| Male | >81.3 | 71.0 - 81.3 | 60.9 - 70.9 | 50.8 - 60.8 | <50.8 |
| Female | >71.1 | 60.9 - 71.1 | 50.8 - 60.8 | 40.6 - 50.7 | <40.6 |
The following are national norms for 16 to 19-year-olds (Davis 2000)[5]
| Gender | Excellent | Above average | Average | Below average | Poor |
| Male | >65cm | 50 - 65cm | 40 - 49cm | 30 - 39cm | <30cm |
| Female | >58cm | 47 - 58cm | 36 - 46cm | 26 - 35cm | <26cm |
The following table is for 15 to 16-year-olds (Beashel 1997)[8]
| Gender | Excellent | Above average | Average | Below average | Poor |
| Male | >65cm | 56 - 65cm | 50 - 55cm | 49 - 40cm | <40cm |
| Female | >60cm | 51 - 60cm | 41 - 50cm | 35 - 40cm | <35cm |
The following table is for adult athletes (20+) (Arkinstall 2010)[9]
| Gender | Excellent | Above Average | Average | Below Average | Poor |
| Male | >70cm | 56 - 70cm | 41 - 55cm | 31 - 40cm | <30cm |
| Female | >60cm | 46 - 60cm | 31 - 45cm | 21 - 30cm | <20cm |
Power Score
A heavier person jumping the same height as a lighter person must do more work as they have a larger mass to move. It is sometimes helpful to convert the vertical jump height to units of power. Power cannot be calculated since the Time the force is acted on the body is unknown. Formulas have been developed that estimate power from vertical jump measurements. In these formulas mass = body weight and VJ = Vertical Jump height.
Lewis Formula
The Lewis formula (Fox & Mathews, 1974)[6] estimates average power.
- Average Power (Watts) = √4.9 x mass (kg) x √VJ (m) x 9.81
Sayers Formula
The Sayers Equation (Sayers et al. 1999)[3] estimates peak power output.
- Peak power (W) = 60.7 x VJ (cm) + 45.3 x mass(kg) - 2055
Harman Formula
Harman et al. (1991)[1] established equations for peak and average power.
- Peak power (W) = 61.9 x VJ (cm) + 36.0 x mass (kg) + 1822
- Average power (W) = 21.2 x VJ (cm) + 23.0 x mass (kg) – 1393
Johnson & Bahamonde Formula
Johnson and Bahamonde (1996)[2] established equations for peak and average power.
- Peak power (W) = 78.5 x VJ (cm) + 60.6 x mass (kg) -15.3 x height (cm) -1308
- Average power (W) = 41.4 x VJ (cm) + 31.2 x mass (kg) -13.9 x height (cm) + 431
Analysis
Analysis of the test result compares it with the athlete's previous results for this test. It is expected that the analysis would indicate an improvement in the athlete's leg strength with appropriate training between each test.
Target Group
This test is suitable for active individuals but not for those where the test would be contraindicated.
Reliability
Test reliability refers to how a test is consistent and stable in measuring its intended measure. Reliability will depend upon how strict the test is conducted and the individual's level of motivation to perform the test. The following link provides various factors influencing the results and test reliability.
Validity
Test validity refers to the degree to which the test measures what it claims to measure and the extent to which inferences, conclusions, and decisions based on test scores are appropriate and meaningful. This test provides a means to monitor the athlete's physical development.
Advantages
- Minimal equipment required
- Simple to set up and conduct
- The athlete can administer the test
- Can be conducted almost anywhere
Disadvantages
- Specific facilities required
- Assistant required to administer the test
References
- HARMAN, E.A. et al. (1991) Estimation of Human Power Output From Vertical Jump. Journal of Applied Sport Science Research, 5(3), p. 116-120
- JOHSON, D. L. and Bahamonde, R. (1996) Power Output Estimate in University Athletes. Journal of strength and Conditioning Research, 10(3), p. 161-166
- SAYERS, S. et al. (1999) Cross-validation of three jump power equations. Med Sci Sports Exerc, 31, p. 572
- CHU, D.A. (1996) Explosive Power and Strength. Champaign: Human Kinetics
- DAVIS, B. et al. (2000) Physical Education and the study of sport. 4th ed. London: Harcourt Publishers. p. 123
- FOX, E.L. and MATHEWS, D.K. (1974) The interval training: conditioning for sports and general fitness. Philadelphia PA: Saunders. p. 257-258
- SARGENT, D.A. (1921) The Physical Test of a Man. American Physical Education Review, 26, p. 188-194
- BEASHEL, P. and TAYLOR, J. (1997) The World of Sport Examined. Croatia: Thomas Nelson and Sons. p. 57
- ARKINSTALL, M et al. (2010) VCE Physical Education 2. Malaysia: Macmillian. p.248
Page Reference
If you quote information from this page in your work, then the reference for this page is:
- MACKENZIE, B. (2007) Sargent Jump Test [WWW] Available from: https://www.brianmac.co.uk/sgtjump.htm [Accessed