

Exercise Bike Fitness Test
Congratulations! You have an exercise bike. It is easy to see how much weight it helps you lose using the bathroom scales, but you will also wish to know your gain in fitness. It is not easy because the fitness level is based upon your Maximum Volume of Oxygen taken up while exercising (VO2 max). However, Astrand (1954)[2] developed a simple solution that relates your Pulse Rate and the Work Output in watts you generate to a VO2 max index, thus to a tabular fitness evaluation.
Test Process
- Use your bike as usual for 5 minutes to warm up at 60 rpm.
- Adjust the loading until your pulse is at least 130.
- Cycle for 6 minutes at that load, and then note your Pulse Rate and the workload in Watts.
- Stop cycling or carry on finishing your session if you wish.
- Carry out your usual cool-down.
Results Evaluation
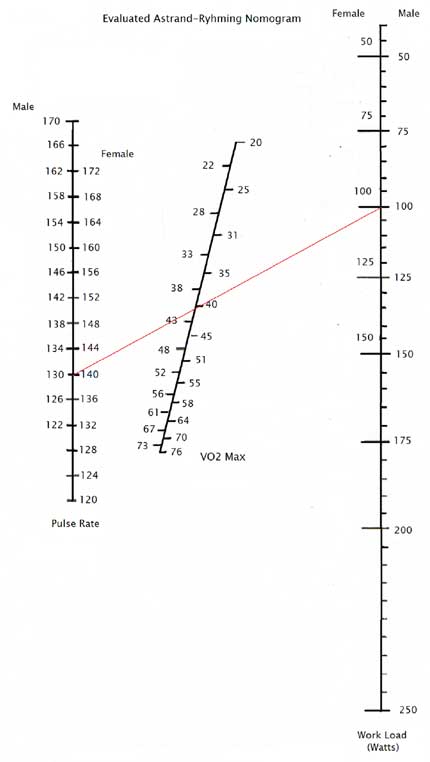
The Nomogram diagram below is used to evaluate your results. It has pulse rate readings for males and females and workload readings for males and females.
Decide which sex you are, then:
- Locate your pulse rate on the left-hand line.
- Locate your workload on the right-hand line.
- See where a line between your two points intersects the middle line – that is, your VO2 max index.
An example line, in red, has been drawn for a 55-year-old male with a pulse rate of 130 and a workload of 100 watts. His resulting VO2 max index is 40.
A larger PDF copy of the Nomogram diagram below is available at this link - Astrand-Rhyming Nomogram[2]
VO2Max Index Tables
Two tables are provided below, one for Females and the other for Males. Choose the row appropriate to your age and see where your index number appears. The column title will tell you your overall level of fitness. For our example, a 55-year-old male with a VO2 max of 40 gives a fitness rating of Good.
Normative data (Heywood 2006)[1] for Females (values in ml/kg/min)
| Age | Poor | Fair | Good | Excellent | Superior |
| 20 - 29 | <36 | 36 - 39 | 40 - 43 | 44 - 49 | >49 |
| 30 - 39 | <34 | 34 - 36 | 37 - 40 | 41 - 45 | >45 |
| 40 - 49 | <32 | 32 - 34 | 35 - 38 | 39 - 44 | >44 |
| 50 - 59 | <25 | 25 - 28 | 29 - 30 | 31 - 34 | >34 |
| 60 - 69 | <26 | 26 - 28 | 29 - 31 | 32 - 35 | >35 |
| 70 - 79 | <24 | 24 - 26 | 27 - 29 | 30 - 35 | >35 |
Normative data (Heywood 2006)[1] for Males (values in ml/kg/min)
| Age | Poor | Fair | Good | Excellent | Superior |
| 20 - 29 | <42 | 42 - 45 | 46 - 50 | 51 - 55 | >55 |
| 30 - 39 | <41 | 41 - 43 | 44 - 47 | 48 - 53 | >53 |
| 40 - 49 | <38 | 38 - 41 | 42 - 45 | 46 - 52 | >52 |
| 50 - 59 | <35 | 35 - 37 | 38 - 42 | 43 - 49 | >49 |
| 60 - 69 | <31 | 31 - 34 | 35 - 38 | 39 - 45 | >45 |
| 70 - 79 | <28 | 28 - 30 | 31 - 35 | 36 - 41 | >41 |
References
- HEYWOOD, V. (2006). The Physical Fitness Specialist Manual, The Cooper Institute for Aerobics Research, Dallas, TX, revised 2005. In: HEYWOOD, V (2006). Advanced Fitness Assessment and Exercise Prescription, Fifth Edition, Champaign, IL: Human Kinetics.
- ASTRAND, P.O. and RYHMING, I. (1954). A nomogram for the calculation of aerobic capacity (physical fitness) from pulse rate during submaximal work. J Appl Physiol, 7, p. 218-221.
Page Reference
If you quote information from this page in your work, then the reference for this page is:
- DENWOOD, V. (2014) Exercise Bike Fitness Test [WWW] Available from: https://www.brianmac.co.uk/articles/article170.htm [Accessed
About the Author
Vic Denwood is a retired RAF Engineer and IBM Business Analyst. This is his first article, and his nomogram scores are Age 68, Pulse 126, and Workload 125 watts.