

Sprinting
The sprints include the following track events: 100 metres, 200 metres, 400 metres, 4 x 100-metre relay and the 4 x 400-metre relay. Although the sprints are events in themselves, the ability to sprint is an essential weapon in an athlete's armoury for many track and field events and sports.
Sprint Technique
Guidance on the sprint technique takes the form of a checklist for each sprint phase, of points for the coach to monitor. The information provided here is for athletes using starting blocks. For details of standing or crouch starts, see the sprints start page.
Pre-race start
- Blocks correctly positioned in the lane (200 metres/400 metres at a tangent to the curve).
- Correct distances from the start line to the front and rear blocks.
- Foot blocks at the correct angles.
- Blocks firmly located on the track.
- The athlete relaxed and focused on the race.
On your marks
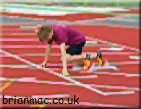 The feet are correctly located in the blocks.
- Fingers behind the line.
- Fingers form a high bridge.
- Hands evenly positioned slightly wider than shoulder-width.
- Shoulders back and vertically above or slightly forward of the hands.
- Arms straight but not locked at the elbows.
- Head and neck in line with the spine.
- Eyes focused on the track (1 to 2 metres ahead).
- Gentle breathing.
- Face and neck muscles relaxed.
Set
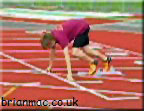 Hold your breath.
- Hips rise slowly to a position above the shoulders.
- Head and neck in line with the spine.
- Eyes focused on the track one or two metres ahead.
- Shoulders vertically above or slightly forward of the hands.
- Front leg knee angle approx. 90 degrees.
- Rear leg knee angle approx. 120 degrees.
- Feet pushed hard back into the blocks.
- Exhale.
- Drive the arms hard.
- Extend the whole body, so there is a straight line through the head, spine, and extended rear leg. The body is approx. 45-degree angle to the ground.
- Eyes Focused on the track 2 to 3 metres.
- Run out of the blocks - do not step or jump out of the blocks.
Drive Phase (0-30m)
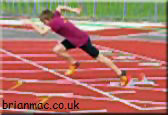 Drive the back leg forward, keeping the heel low until the shin is approx. 45° to the ground and then drive the foot down (see picture to the right), hitting the ground just behind the body's centre of mass.
- Over the next 7-8 strides (approx. 10 metres), the angle of the shin of the front leg, before it is driven down, will increase by 6-7/stride so that by the 7-8 stride, the shin is vertical.
- Over the first 7-8 strides, the whole-body angle will increase from 45° to approx. 30° degrees - approx. 2°/step.
- After the first 7-8 strides, you will be at approx.70% of your max velocity.
- Eyes focused on the track to keep low to allow the build-up of speed.
- Forward lean of the whole body with a straight line through the head, spine and extended rear leg.
- Face and neck muscles relaxed (no tension).
- Shoulders held back and relaxed, square in the lane at all times.
- Arms move with a smooth forward and backward action - not across the body - drive back with elbows - hands move from shoulder height to hips.
- Elbows maintained at 90 degrees (angle between upper and lower arm).
- Hands Relaxed - fingers loosely curled - thumb uppermost.
- Legs - fully extended rear leg pushing off the track with the toes - drive the leg forward with a high knee action with the knee pointing forward and with the heel striking under the backside (not the back of the backside as the knee is low and pointing down to the ground) - extend lower leg forward of the knee (rear leg drive will propel the foot ahead of the knee) with toes turned up - drive the foot down in a claw action with a ball of foot/toe strike on the track vertically below the knee - pull the ground under you into a full rear leg extension - (elbow drive assisting the whole action).
- On the ball of foot/toes at all times - feet pointing forward straight down the lane.
- Elbow drive commences just before the rear leg drive.
- Fast leg action, right stride length allowing continual acceleration.
- The appearance of being smooth and relaxed but driving hard with elbows and legs.
- The drive is maintained for the first 20-30 metres (approx.16-17 strides), at the end of which the body is tall with a slight forward lean.
- At the end of this phase, you will be at approx. 90% of your max velocity.
Stride Phase (30-60m)
- Smooth transitions from the drive phase to the stride phase.
- Eyes focused at the end of the lane - tunnel vision.
- Head in line with the spine - held high and square.
- Face relaxed - jelly jaw - no tension - mouth relaxed.
- Chin down, not out.
- Shoulders held down (long neck), back (not hunched), relaxed and square in the lane at all times.
- Smooth forward and backward action of the arms- not across the body - drive back with elbows - brush vest with elbows - hands move from shoulder height to hips for men and from bust height to hips for the ladies.
- Elbows are held at 90 degrees at all times (angle between the upper arm and lower arm).
- Hands relaxed - fingers loosely curled - thumb uppermost.
- Hips tucked under - slight forward rotation of the hip with forward leg drive to help extend the stride.
- Legs - fully extended rear leg pushing off the track with the toes - drive the leg forward with a high knee action with the knee pointing forward and with the heel striking under the backside (not the back of the backside as the knee is low and pointing down to the ground) - extend lower leg forward of the knee (rear leg drive will propel the foot ahead of the knee) with toes turned up, stepping over the knee of the lead leg - drive the foot down in a claw action with a ball of foot/toe strike on the track just behind the body's centre of mass - pull the ground under you into a full rear leg extension - (elbow drive assisting the whole action).
- On the ball of foot/toes with the feet pointing forward straight down the lane.
- No signs of straining or tension in the face, neck and shoulders.
- The appearance of being Tall, Relaxed and Smooth with maximum Drive.
- See the sprint technique photo sequence.
- At or close to the end of this phase, you will have reached your max velocity.
Lift Phase (60m+)
Around 50-60 metres, we will have reached max velocity, and now we start to slow down. Technique as the Stride Phase but with emphasis on:
- High knee action (prancing).
- Leg action is fast and light as if running on a hot surface.
- Fast arms - more urgency.
- Hands slightly higher at the front.
Coaching Notes
As you monitor the athlete's technique, look for:
- Tall action
- This means erect, running on the ball of foot/toes (not heels) with full extension of the back, hips and legs as opposed to 'sitting down' when running.
- Relaxed action
- This means moving easily, as opposed to tensing and 'working hard' to proceed. Let the movements of the running flow. Keep the hands relaxed, the shoulders low and the arm swing rhythmically by the sides.
- Smooth action
- This means floating across the top of the ground. All motion should be forward, not up and down. Leg action should be efficient and rhythmic. The legs should move easily under the body like a wheel rolling smoothly along.
- Drive
- This means push from an extended rear leg, rear elbow drive with a high forward knee drive followed by a strike and claw foot action just behind the body's centre of gravity.
Sprint Starts
Canadian researchers, Sleivert and Taingahue (2004)[1], investigated the relationship between sprint start performance and selected conditioning training. When a sprinter leaves the blocks, the drive against the blocks and the first few steps rely on concentric muscular strength. A concentric muscle contraction occurs when a muscle shortens as it contracts.
A squat jump is an example of concentric muscle contraction, which simulates the sprint start. 4 sets of 3 repetitions with a loading of 30-70% of 1RM can be used to develop maximal concentric force.
Lower into the squat position, and hold for 1 to 2 seconds to switch off the stretch/reflex, stretch/shortening cycle and allow for a more powerful contraction. Developing concentric muscle contraction will help the athlete's sprint start and acceleration over the first 4 or 5 strides.
Right foot forward or left?
A question often asked regarding the starting blocks is, "Which foot should be in the rear block?" A team of researchers, Eikenberry et al. (2008)[2], discovered that when:
- The left foot was in the rear block, reaction time was better.
- The right foot was in the rear block movement and the total response time was better - the time from the stimulus (gun) until the end of the movement.
The results suggest that the right foot in the rear block will produce a more powerful drive from the blocks.
Perhaps a way forward would be to evaluate the athlete's times over the first ten metres, for both start positions, to determine which produces the fastest acceleration phase for the athlete.
Stride Length
Out of the blocks, the initial foot strike should be around 50-60cm from the start line. The stride length should then progressively increase on each stride by 10-15cm until they reach their optimal stride length of about 2.30 metres.
If the athlete lands at 50cm from the start line and increases their stride length by 10cm/stride, then they will reach their optimal stride length around their 19th stride - approx. 26m from the start line. If they could maintain their 2.30m stride length, they would cross the finish line on their 51st stride.
If the athlete lands at 60cm from the start line and increases their stride length by 15cm/stride, then they will reach their optimal stride length around their 13th stride - approx. 20m from the start line. If they could maintain their 2.30m stride length, then they would cross the finish line on their 49th stride.
Rehearsal of this acceleration phase should be conducted regularly. Markers can be placed at the side of the track to assist the athlete in getting the feel of the increased stride length and acceleration. The marker settings for an athlete who lands at 60cm from the start line and then increases their stride length by 15cm/stride are as follows: 0.60m, 1.35m, 2.25m, 3.30m, 4.50m, 5.85m, 7.35m, 9.00m, 10.80m, 12.75m, 14.85m, 17.10m. (Saunders 2004)[3].
Stride Frequency (Strike Rate)
The time of a stride (ST) comprises the time you are in the air (AT) plus the time you are in contact with the ground (GT). Elite sprinters typically have a GT of 0.09 secs and an AT of 0.11 secs, giving them an ST=0.2 seconds. The stride frequency of an elite athlete is in the range of 4.8 to 5.2 strides per second (1sec ÷ 0.2sec = 5 strides). The difference between an elite and an average sprinter is not greater strength but reduced ground contact time (GT) achieved with developed skill and motor coordination.
Acceleration Training
Zafeiridis et al. (2005)[4] looked at weighted sledge training and its effect on sprint acceleration, and they concluded that training with a weighted sledge would help improve the athlete's acceleration phase. The session used in the research was 4 x 20m and 4 x 50m maximal effort runs.
Lockie et al. (2003)[5] investigated the effects of various loadings and concluded that when using a sledge, a light weight of approx. 10-15% of body weight should be used so that the dynamics of the acceleration technique are not negatively affected.
Starts over 10-20 metres performed on a slight incline of around five degrees have an important conditioning effect on the calf, thigh and hip muscles (they have to work harder because of the incline to move) that will improve sprint acceleration.
Sprinting Speed
Downhill sprinting is a method of developing sprinting speed following the acceleration phase. Use 40 to 60 metres to build up to full speed and then maintain the momentum for a further 30 metres. A session could comprise 2 to 3 sets of 3 to 6 repetitions. This method's difficulty is finding a suitable hill with a safe surface. A mountain with a maximum of 15� decline is most appropriate.
Overspeed work could be carried out on the track when there are prevailing strong winds - run with the wind behind you.
Research by Mero et al. (1998)[6] indicates that an elite sprint athlete's foot contact time with the track is 0.08 to 0.1 seconds, so it is vital with plyometric training that each ground contact (approx. 1/10 of a second) is made as dynamically as possible. Bounding, hopping, and depth jumps from low heights (30cm) can speed up ground contact times, trigger the appropriate neural pathways, and recruit fast-twitch muscle fibres. Example sessions for a mature athlete are:
- 4 x 10 bounds with a 20m run out.
- 4 x 10-speed hops.
- Depth jumps off a 40cm box:
4 x 4 step off, land and jump for height.
4 x 4 step off, land and jump for distance.
Repetitions, sets and recovery should be adjusted to focus on the quality of execution, not the number of executions.
Bend Running Technique
In the 200m and 400m set up your blocks to form a straight line (tangent) to the inside line of your lane allowing you to initially accelerate in a straight line before moving into bend running. When running the curve, you slightly twist your shoulders so that the right arm comes across the body to the midline, and the left arm goes straight back to the front above your inside lane line. The right foot comes across the front of the body, landing in front of the left foot. You will automatically lean into the curve to counteract the inertia which is trying to pull you to your right. Your left foot lands on the ground about 6 inches from the line. Remember that if you touch the lane line, you will be disqualified.
Training Programs
A training program has to be developed to meet the athlete's individual needs and consider many factors: gender, age, strengths, weaknesses, objectives, training facilities etc. As all athletes have different needs, a single program suitable for all athletes is not possible.
Training Pathway
Athletes in the Event Group stage
The following is an annual training program suitable for athletes in the Event Group development stages for the sprint and hurdle events.
Athletes in the Event stage
The following are event-specific annual training programs suitable for athletes in the Event development stage:
Training Methods
The various forms of training include:
- Speed.
- Speed endurance.
- Specific endurance - consists of intervals at your goal pace, but not so long as to replicate the entire race.
- Special endurance - the aim is to develop the capacity for maintaining maximal or near-maximal velocity.
- Intensive tempo - runs completed at 75-95% effort to overload the lactic energy system.
- Extensive tempo - a slower version of intensive tempo where we try to avoid the build-up of lactic.
- Resisted sprints - uphill running, running with a sledge or tyre, running into a headwind.
- Assisted sprints - downhill running, running with the wind.
Developing the Energy Systems
The following table, Rogers (2000)[7], indicates the training exercises to develop the sprinter's energy systems and guide you in preparing training programs.
| Energy System | Type of training | Distance | Speed | Recovery | Total distance |
| Aerobic Power | Extensive Tempo | >100m | 60-70% | 30-90 sec | 1400-3000m |
| Aerobic Capacity | Extensive Tempo | >200m | 70-80% | 30-90 sec | 1400-2000m |
| Aerobic & Anaerobic | Intensive Tempo | >80m | 80-90% | 30-120 sec | 800-1800m |
| Anaerobic | Speed | 20-80m | 90-95% | 3-5 min | 300-800m |
| Alactic | Speed | 20-80m | 95-100% | 3-5 min | 300-500m |
| Anaerobic | Speed Endurance | 30-80m | 90-95% | 1-2 min | 300-800m |
| Alactic | Speed Endurance | 30-80m | 95-100% | 2-3 min | 300-800m |
| Anaerobic | Speed Endurance | 80-150m | 90-95% | 5-6 min | 300-900m |
| Glycolytic | Speed Endurance | 80-150m | 95-100% | 6-10 min | 300-600m |
| Anaerobic | Special Endurance | 150-300m | 90-95% | 10-12 min | 600-1200m |
| Glycolytic | Special Endurance | 150-300m | 95-100% | 12-15 min | 300-900m |
| Lactic acid tolerance | Special Endurance | 300-600m | 90-95% | 15-20 min | 600-900m |
Weight Training
The following is an example weight training program for a sprinter.
| Phase | Loading | Day 1 | Day 2 | Day 3 |
| General | 3 sets 12 RM | Squats Step-Ups Bench Press Dumbbell Arm Swings |
Lunges Single Leg Squats Bench Press Power Cleans |
Squats Step-Ups Bench Press Snatch |
| Specific | Power Cleans & Snatch 3 sets 10RM Other exercises 3 sets of 5 reps at 10RM |
Power Cleans Bench Press Step Ups Dumbbell Arm Swings |
Snatch Bench Press Single leg squats Lunges with dumbbells Dumbbell Arm Swings |
Squats Bench Press |
| Competition | 3 sets of 5 reps at 8RM | Power Cleans Bench Press Step Ups Dumbbell Arm Swings |
Snatch Bench Press Single leg squats Lunges with dumbbells Dumbbell Arm Swings |
Rest |
Analysis of running the 100 metres
The following table (Arnold 1992)[9] provides the reaction time and 20-metre split times for the men's 100-metre final at the Barcelona Olympics in 1992.
| Athlete | Reaction | 20m | 40m | 60m | 80m | 100m |
| Christie (UK) | 0.139 | 2.93 | 4.74 | 6.48 | 8.22 | 9.96 |
| Fredericks (NAM) | 0.138 | 2.91 | 4.74 | 6.50 | 8.26 | 10.02 |
| Mitchell (USA) | 0.143 | 2.93 | 4.76 | 6.52 | 8.28 | 10.04 |
| Surin (Can) | 0.124 | 2.89 | 4.72 | 6.50 | 8.28 | 10.09 |
| Burrell (USA) | 0.165 | 2.99 | 4.82 | 6.58 | 8.32 | 10.10 |
| Adeniken (NGR) | 0.183 | 3.01 | 4.84 | 6.58 | 8.34 | 10.12 |
| Stewart (JAM) | 0.154 | 2.95 | 4.78 | 6.56 | 8.36 | 10.22 |
| Ezinwa (NGR) | 0.172 | 2.99 | 4.84 | 6.62 | 8.42 | 10.26 |
Evaluation of speed
The following table provides each athlete's speed (metres/second) at each 20-metre point. You will note that, except for Burrell, the athletes achieved their maximum speed at 60 metres.
| Athlete | Start | 20m | 40m | 60m | 80m | 100m |
| Christie (UK) | 0 | 6.83 | 11.05 | 11.49 | 11.49 | 11.49 |
| Fredericks (NAM) | 0 | 6.87 | 10.93 | 11.36 | 11.36 | 11.36 |
| Mitchell (USA) | 0 | 6.83 | 10.93 | 11.36 | 11.36 | 11.36 |
| Surin (Can) | 0 | 6.92 | 10.93 | 11.24 | 11.24 | 11.05 |
| Burrell (USA) | 0 | 6.69 | 10.93 | 11.36 | 11.49 | 11.24 |
| Adeniken (NGR) | 0 | 6.64 | 10.93 | 11.49 | 11.36 | 11.24 |
| Stewart (JAM) | 0 | 6.78 | 10.93 | 11.24 | 11.11 | 10.75 |
| Ezinwa (NGR) | 0 | 6.69 | 10.81 | 11.24 | 11.11 | 10.87 |
| Average | 0 | 6.78 | 10.93 | 11.35 | 11.32 | 11.17 |
If you plot the average speed for these athletes at the 20-metre mark, you find that maximum speed is achieved around 60 metres and from this point, speed declines to the 100-metre point when it is approximately the same speed as that made at 50 metres.
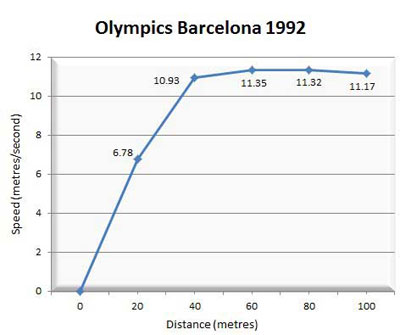
The objective now for coaches and athletes is to maintain acceleration through to 80 metres and reduce the decline in speed from 80m to 100m.
17 years later - 100 metres Split Times 2009
The following table provides the reaction time and 20-metre split times for the men's 100-metre final at the World Championships in Berlin in 2009.
| Athlete | Reaction | 20m | 40m | 60m | 80m | 100m |
| Bolt (JAM) | 0.146 | 2.89 | 4.64 | 6.31 | 7.92 | 9.58 |
| Gay (USA) | 0.144 | 2.92 | 4.70 | 6.39 | 8.02 | 9.71 |
| Powell (JAM) | 0.134 | 2.91 | 4.71 | 6.42 | 8.10 | 9.84 |
| Bailey (ANT) | 0.129 | 2.92 | 4.73 | 6.48 | 8.18 | 9.93 |
| Thompson (TRI) | 0.119 | 2.90 | 4.71 | 6.45 | 8.17 | 9.93 |
| Chambers (UK) | 0.123 | 2.93 | 4.75 | 6.50 | 8.22 | 10.00 |
| Burns (TRI) | 0.165 | 2.94 | 4.76 | 6.52 | 8.24 | 10.00 |
| Patton (USA) | 0.149 | 2.96 | 4.85 | 6.65 | 8.42 | 10.34 |
Evaluation of speed
The following table provides each athlete's speed (metres/second) at each 20-metre point. You will note now that all the athletes achieved their maximum speed at 80m.
| Athlete | Start | 20m | 40m | 60m | 80m | 100m |
| Bolt (JAM) | 0 | 6.92 | 11.43 | 11.98 | 12.42 | 12.05 |
| Gay (USA) | 0 | 6.85 | 11.24 | 11.83 | 12.27 | 11.83 |
| Powell (JAM) | 0 | 6.87 | 11.11 | 11.70 | 11.90 | 11.49 |
| Bailey (ANT) | 0 | 6.85 | 11.05 | 11.43 | 11.76 | 11.43 |
| Thompson (TRI) | 0 | 6.90 | 11.05 | 11.49 | 11.63 | 11.36 |
| Chambers (UK) | 0 | 6.83 | 10.99 | 11.43 | 11.63 | 11.24 |
| Burns (TRI) | 0 | 6.80 | 10.99 | 11.36 | 11.63 | 11.36 |
| Patton (USA) | 0 | 6.76 | 10.58 | 11.11 | 11.30 | 10.42 |
| Average | 0 | 6.85 | 11.05 | 11.54 | 11.82 | 11.40 |
If you plot the average speed for these athletes at the 20-metre mark, you find that maximum speed is now achieved at around 80 metres and from this point, speed declines to the 100-metre point when it is approximately the same speed as that made at 50-60m metres.
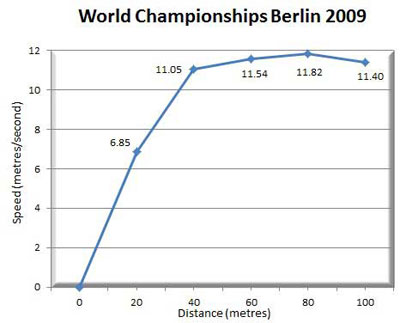
The objective now for coaches and athletes is to maintain acceleration through to 90 metres and reduce the decline in speed from 90m to 100m.
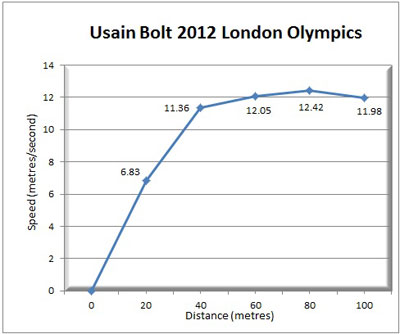
Usain Bolt 2012 London Olympics
The following table provides the 20-metre split times in the final of the 100-metres for Usain Bolt.
| Athlete | Start | 20m | 40m | 60m | 80m | 100m |
| Bolt (JAM) | 0 | 2.93 | 4.69 | 6.35 | 7.96 | 9.63 |
The following table provides the speed (metres/second) at each 20-metre point.
| Athlete | Start | 20m | 40m | 60m | 80m | 100m |
| Bolt (JAM) | 0 | 6.83 | 11.36 | 12.05 | 12.42 | 11.98 |
If you plot the speed at the 20-metre mark, you find that maximum speed is still achieved at around 80 metres and from this point, speed declines to the 100-metre point when it is approximately the same speed as that made at 50-60m metres.
Evaluation Tests
The following evaluation tests can be used to monitor the sprint athlete's development:
- 10-stride test for 100 metres and 200 metres athletes.
- 150-metres Endurance test for 100 metres athletes.
- 250 metres Endurance test for 200 metres athletes.
- 30-metre acceleration test for 100 metres and 200 metres athletes.
- 40-yard sprint test to predict your potential 400 metres time.
- 400-metre control tests for 400 metres athletes.
- 400 metre drop-off test for 100 metres and 200 metres athletes.
- 60-metre speed test for 100 metres and 200 metres athletes.
- Balke VO2 max test for endurance.
- Cooper VO2 max test for endurance.
- Flying 30 metres speed test for 100 metres and 200 metres athletes.
- Leg Elastic Strength test.
- Quadrathlon is an excellent all-around test.
- RAST - Running-based Anaerobic Sprint Test.
- Standing Long Jump test.
- Strength test - upper body (Bench Press).
- Strength test - lower body (Leg Press).
- Sit-Ups test - abdominal strength.
- Sit and Reach test - lower back and hamstring test.
- Vertical Jump test.
Sprint Time Predictors
Test results make it possible to predict potential times for a sprint event. The available sprint time predictors are:
- Predict your 30m to 100m, 120m, 150m, 200m and 250m times based on your current time for any of these distances.
- Predict your 150m, 200m, 300m, 400m, 500m and 600m times based on your current time for any of these distances.
Bounding Controls
Dick (1987)[8] provides a rough guide linking 3 Bounds (from a standing start) and Standing Long Jump to competition performance.
| Target Time | Standing Long Jump | 3 Bounds |
| 10.70 - 10.2.0 | 2.90- 3.20 | 10.00 - 9.20 |
| 11.10 - 10.71 | 2.70 - 2.89 | 9.19 - 8.50 |
| 11.70 - 11.11 | 2.60 - 2.69 | 8.49 - 7.90 |
| 12.20 - 11.71 | 2.50 - 2.59 | 7.89 - 7.50 |
| 12.70 - 12.21 | 2.40 - 2.49 | 7.49 - 7.20 |
| 13.2 - 12.71 | 2.30 - 2.39 | 7.19 - 6.80 |
Free Calculator
Free Microsoft Excel spreadsheet that you can download and use on your computer.
- 100 metres to 800 metres time predictions based on 100 metres to 800 metres time.
Rules of Competition
The competition rules for this event are available from:
References
- SLEVERT, G. and TAINGAHUE, M. (2004) The relationship between maximal jump-squat power and sprint acceleration in athletes. Eur J Appl Physiol., 91 (1), p. 46-52
- EIKENBERRY, A. et al. (2008) Starting with the "right" foot minimises sprint start time. Acta Psychol (Amst), 127 (2), p. 495-500
- SAUNDERS, R. (2004) Five components of the 100m sprint. Modern Athlete and Coach, 42 (4) p. 23-24
- ZAFEIRIDIS, A. et al. (2005) The effects of resisted sled-pulling sprint training on acceleration and maximum speed performance. J Sports Med Phys Fitness, 45(3), p. 284-290
- LOCKIE, R.G. et al. (2003) Effects of resisted sled towing on sprint kinematics in field-sport athletes. J Strength Cond Res., 17 (4), p. 760-767
- MERO et al. (1992) Biomechanics of sprint running. Sports Med, 13, p. 266-274
- ROGERS, J.L. (2000) USA Track and Field Coaching Manual. Champaign IL: Human Kinetics
- DICK, F. (1987) Sprints and Relays. 5th ed. London: BAAB. p. 24
- ARNOLD, M. (1992) 100 Metres Men. Athletics Coach, 26 (4), p. 11
Page Reference
If you quote information from this page in your work, then the reference for this page is:
- MACKENZIE, B. (2001) Sprinting [WWW] Available from: https://www.brianmac.co.uk/sprints/index.htm [Accessed