

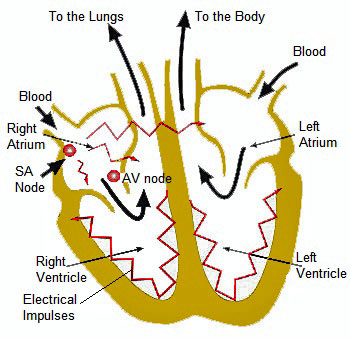
The Heart
The function of the heart is to circulate blood around the body. The heart comprises four chambers:
- Right Atrium.
- Left Atrium.
- Right Ventricle.
- Left Ventricle.
Functionally the heart comprises two pumps:
- The right Atrium receives blood from the body (deoxygenated blood), and the right ventricle pumps it into the lungs for aeration (removing carbon dioxide and adding oxygen).
- The left atrium receives the oxygenated blood from the lungs, and the left ventricle pumps it around the body.
Blood Pressure
Blood pressure represents the force (pressure) exerted by blood against the arterial walls during a cardiac cycle (heartbeat) which consists of heart muscle contraction (systole) and heart muscle relaxation (diastole).
The higher the two pressure measurements, the more systolic blood pressure occurs as the heart muscles contract pumping blood into the aorta. Heart muscles then relax, allowing the heart to refill with blood, and the lowest pressure reached represents diastolic blood pressure.
Average systolic blood pressure in adults varies between 110 and 140 mm Hg, and diastolic pressure ranges between 60 and 90 mm Hg.
Blood Pressure Classification
The following table is the NICE[4] classification of blood pressure levels. (Note: "mm Hg" means millimetres of mercury)
| Systolic (mm Hg) | Diastolic (mm Hg) | Classification |
| <130 | <85 | Normal |
| 130-139 | 85-89 | High Normal |
| 140-159 | 90-99 | Hypertension (stage 1) |
| 160-179 | 100-109 | Moderate Hypertension (stage 2) |
| >180 | >110 | Severe Hypertension (stage 3) |
Resting Heart Rate
The average person's resting heart rate is between 70 and 90 beats per minute (bpm). The term tachycardia is applied to a rapid heart rate (over 100 bpm), and the term bradycardia indicates a slow heart rate (less than 50 bpm). Endurance athletes may have a resting heart rate of less than 50 bpm due to having an enlarged heart due to their training regime.
Cardiac Output
This is the amount of blood pumped from your heart and is calculated by multiplying heart rate by stroke volume (the amount of blood ejected by the heart in each beat). An endurance athlete will have a lower resting heart rate and a larger stroke volume than a non-athlete. The cardiac output for an endurance athlete is approx. thirty-five litres, while that for the non-athlete is 22 litres.
Starling's Law of the Heart
Starling's law of the heart states that the heart's stroke volume increases in response to an increase in the volume of blood filling the heart. A paper by Solaro (2007)[3] examines the mechanism of Starling's Law.
Blood Pressure daily variations
Millar-Craig et al. (1978)[1] found that blood pressure was lowest at 3-am and began to rise again during the early hours of the morning before waking.
Classification of the Hypertensive Disorders of Pregnancy
Higgins et al. (2001)[2] define the classifications as:
- Chronic hypertension - hypertension (>140 mm Hg systolic or >90 mm Hg diastolic) that is present and observable before pregnancy or that is diagnosed before the 20th week of gestation.
- Pre-eclampsia-eclampsia - usually occurs after 20 weeks of gestation.
- Pre-eclampsia superimposed upon chronic hypertension - with hypertension and no proteinuria early in pregnancy >20 weeks, new-onset proteinuria (urinary excretion of 0.3 g Protein or higher in a 24-hour specimen).
- Gestational hypertension - blood pressure elevation detected for the first time after mid-pregnancy without proteinuria.
References
- MILLAR-CRAIG, M. W. and BISHOP, C. N. and RAFTERY, E. B. (1978) Circadian Variation of Blood-Pressure. The Lancet, 311 (8068), p. 795-797
- HIGGINS, J. R. and SWIET, M. (2001) Blood-pressure measurement and classification in pregnancy. The Lancet, 357 (9250), p. 131-135
- SOLARO, R. J. (2007) Mechanisms of the Frank-Starling Law of the Heart: The Beat Goes On, Biophys J., 93 (12), p. 4095-4096
- HYSLOP, J. et al. (2011) Hypertension - Clinical management of primary hypertension in adults. NICE clinical guideline 127 - Hypertension p. 10
Page Reference
If you quote information from this page in your work, then the reference for this page is:
- MACKENZIE, B. (2001) The Heart [WWW] Available from: https://www.brianmac.co.uk/bloodp.htm [Accessed