

Pre & Post Exercise Stretching
The following article has been reproduced with the author's kind permission, Leandros Callej Leandros is a physiotherapist, fitness consultant and athletics coach (Sprints and Jumps).
Aim: To investigate the most appropriate timing of stretching within a training session and during competitions, in terms of improving performance.
Methods: A random sample of 35 athletes (12 to 16 years) was divided into four groups. Pre-exercise stretching (GRP1) was compared to post-exercise stretching (GRP2), stretching both prior and after exercise (GRP3) and not stretching at all (GRP4). All four groups were monitored over 18 weeks and tested at regular intervals using a pre-test (T1), post-test (T5) and three intermediate testing dates (T2, T3, T4). A well-established battery of tests was used to monitor flexibility, explosive power, coordination, balance, agility, speed and endurance.
Results: The results showed that each parameter is affected differently. The effects of stretching on flexibility indicate that stretching has minimal influence on this parameter when investigated as only one part of the whole training session. Similar but more evident effects were reported for balance. Balance improved significantly in both GRP2 between T1 and T3 (p=0.0461) and in GRP3 between T1 and T5 (p=0.0156). Although stretching seemed to enhance explosive power, given at whichever part of the training session, no significant variations were obtained whatsoever. In contrast, coordination and speed were both negatively influenced by the stretching regime. The only significant change in coordination was registered by GRP1 between T1 and T3 (p=0.0209). On the other hand, speed alterations were only noted in GRP2 and GRP3 between T3 and T5 (both p=0.0391). GRP4 exhibited the least improvement in both coordination and speed. No significant relationship could be obtained between the different timing of stretching and agility (p>0.05). Although all groups enhanced their endurance capacities, the best improvement was noted in GRP3 between T1 and T5 (p=0.0156), indicating that stretching after exercise will have the full effect on stamina.
Conclusions: The results suggest that the timing of the stretching protocol will diversely affect different parameters. Therefore, the timing of stretching should correlate with the specific training session to be undertaken.
Introduction
In any kind of dynamic sport, stretching is one of the first things to be implemented in the training program. It is considered one of the fundamental requirements, which must be acquired before getting involved with more sport-specific work. Even more, mobility work has become so important that every sport has adopted its specific stretching regime (Appleton, 1998; Norris, 1993; Thompson, 1991).
However, does stretching before exercise enhance performance? On the other hand, would it be better to leave stretching as the last thing in a training session? Alternatively, can it be ignored completely?
There are several schools of thought regarding all of these concepts. Traditional research maintains that stretching should always precede exercise (Shellock and Prentice, 1985; Worrell Smith and Winegardner, 1994; Jones and Barker, 1996, and Norris, 1993) while more recent studies have shown that pre-exercise stretching hinders performance (Grantham, 2000; Fowles, Sale and Mc Dougall, 2000; Avela, Kyrolainen and Komi, 1999; Holder-Powell and Rutherford, 1999; Kubo, Kawakami and Fakunaga, 1999; Fowles and Sale, 1997; Rosenbaum and Hennig, 1995 as cited in Hartley, 2000). Further research suggests that post-exercise stretching entails more benefits than pre-exercise stretching (Anderson, 2000; Brucker, Knight and Rubley, 2000; Appleton, 1998; Lund et al. 1998; Young and Pitt, 1996, Smith et al. 1993). However, most of these studies were carried out under standardized conditions and therefore, cannot be practically implemented in the field of play. Most of these studies focus on muscle and tendon physiology, rather than sports performance.
Monitoring field performance in the sporting arena itself will yield more practical information. This study was, therefore aimed at evaluating the difference between pre-exercise and post-exercise stretching and their effect on-field performance in young athletes.
The performance parameters, which were monitored in this study, are flexibility, power, coordination, balance, agility, speed and endurance. These bio-motor factors are the main physical requirements in major sports. Body mass index was also assessed.
The tests used are standard tests obtained from EUROFIT, Sports Coach and Sports Educational Chart. These tests have been evaluated and have proven that they are specific in assessing only one particular parameter (Wood, 2001; Sports Coach, 2001; Calorie Counter, 2001; Strel, 1997; Jones and Barker, 1996; Jackson and Baker, 1986, Johnson and Nelson, 1986 and Docherty and Collins, 1976, as cited in Docherty, 1996; Jackson and Baker, 1986, and Jackson and Langford, 1989, as referred to in Maud and Cortez-Cooper, 1995; Beunan, 1987 and Renson, 1987, as mentioned in Council of Europe, 1993; Alter, 1988; Council of Europe, 1988; Council of Europe, 1987).
Since injuries place the athlete "out of practice" for a considerable amount of time, they indirectly influence performance. Therefore, the lower the risk of injury, the better the ultimate performance will be. Several studies have found a significant relationship between stretching and injury prevention (Tabrizi et al. 2000; Appleton, 1998; Jones and Barker, 1996; Norris, 1993 and Thompson, 1991), while other investigations found no correlation (Pope, Herbert and Kirwan, 2000; Pope, Herbert, Kirwan and Graham, 2000; Shrier, 1999; Gleim and Mc Hugh, 1997 and Lally, 1994) or even the opposite effect (Shrier, 1999). Due to its indirect influence on performance, injury occurrence was also monitored in this investigation.
This study sheds light on the effect of diverse stretching procedures on specific biomotor-related physical parameters, thus adding information regarding the training practice to attain a greater level of performance. Knowing what to do and when to do stretching will enable the sports management team to be more efficient and safer in their exercise prescription.
Methodology
Despite differences in context and focus, studies in physical performance have one common entry point - they all result from systematic analysis and monitoring of physical fitness. Moreover, they rigorously adopt a multi-dimensional approach, as they prove that there is no one complete test that can determine one's overall fitness. When examining the effects of the different timing of stretching on performance, several tests were utilized, where each test measures one specific fitness component. All tests presented here (Council of Europe, 1993, Sports Educational Chart, 1997, Wood, 2001 and Sports Coach, 2001) are indirect fitness tests, as they predict a physiological factor from performance, or else measure performance itself. This is in contrast with direct fitness testing, which involves the direct measurement of a physiological factor in connection with a fitness component (Wilkinson & Moore, 1995).
Design
The research consisted of a longitudinal study with an experimental design. The athletes were given a stretching regime (refer to the film provided as additional material) to carry out according to the specified timing in the training sessions. The athletes trained an average of five times per week (depending on the week's training load) for a total of 18 weeks, thus completing 90 sessions. The experimental hypothesis was tested by using pre-test and post-test measures along with three intermediate testing dates. This method allowed regular monthly assessment of the physical parameters for four consecutive months. Thus, any progression or regression could be detected more accurately. The athletes were chosen from a local club (Pembroke Athleta Mita). Assuming that athletes joined this club at random, irrelevant of age, gender, locality, education and socioeconomic status, will already make the sample a random one. Executing the study on a national basis is impractical mainly because of the variety of training programmes and inter-club rivalry.
Contacts and Scheduling
Contact with the president of Athleta Pembroke Mita athletic club was made in May 2001. A standard request letter was drafted to this club. Immediate approval was granted. Another request letter was submitted to the president of the Malta Amateur Athletic Association for the use of the Micallef St. John Track and Field premises at Marsa. Here again, the request was accepted. Therefore, the study was scheduled as shown in the table below.
| Pre-test | Intermediate 1 | Intermediate 2 | Intermediate 3 | Post-test |
| 29th Jul 01 | 26th Aug 01 | 30th Sep 01 | 28th Oct 01 | 2nd Dec 01 |
| 4 weeks | 5 weeks | 4 weeks | 5 weeks |
Testing dates and intervals
Subjects
The subjects were provided with a consent document plus a questionnaire. These two forms had to be filled in by the athletes and signed by them and their parents. If these documents were not submitted before the first testing date, the athletes were not eligible to take part in the study. The questionnaire was aimed at creating specific criteria by which the subjects were chosen. The final number of subjects (n=40) was divided into four groups.
Assigning the subjects at random made the study more reliable. The ratio of male to female athletes (3:7) was representative of the same ratio present in Maltese track and field athletics (as seen in Aggregates result sheets 1999, 2000, 2001).
Control of Variables
Several other variables could have influenced the outcome. These were controlled in the following manner:
- Effects of warming up and cooling down: this study aimed to investigate the effects of stretching and not warming up and cooling down. Therefore, all groups carried out an aerobic warming-up and cooling-down and then added the stretching regime at the given time;
- Different training schedule: Along with the stretching regime, the athletes carried out their usual training schedule. Although the athletes were gathered from two different coaches, they had the same training load (volume and intensity) as the study was carried out in the recovery and pre-season phases;
- Altered anthropometric measures: A gain or loss in height and/or weight could affect the performance in some of the tests (e.g. SBJ). However, if equal changes occur in both of these measures together, they will cancel out each other. Therefore, BMI was used as an indication of excessive change. In this study, only those subjects who had a discrepancy of less than 2 kg/m² in BMI from the beginning to the end of the study were taken into consideration.
Tests Used
Two things required consideration for the selection of the tests to administer. First, it was important to select tests that covered a range of fitness components. Secondly, the relative administration time, expenditure and location requirements had to be evaluated. Hence, the tests noted in the table below were deemed the most appropriate.
| Physical Factor | Test | Abbreviation |
| Anthropometric Measures Weight Height | Body Mass Index | BMI |
| Flexibility | Sit and Reach | SAR |
| Balance | Flamingo Balance | FLB |
| Explosive Power | Standing Broad Jump | SBJ |
| Coordination | Coordination Boxes | COB |
| Speed | 60 Metres | 60M |
| Agility | 10 x 5 Metres Shuttle Run | SHR |
| Endurance | 600 Metres | 600 |
The physical parameters assessed, and the tests used
Note that all of these tests are simple enough for young athletes to understand. They are also relatively cheap, straightforward and quick to administer.
Results
The results obtained from the statistical analysis were vast and varied. The preliminary investigation of the available results was aimed at achieving a diagrammatic representation of the tendency of change in the performance of each group in every motor factor. Substantial within-group variations and inter-group relationships will already be visible in these illustrations. However, statistical analysis through the Wilcoxon signed-ranks test and Analysis of Variance will show if such alterations are within the 95% confidence limits.
Mean Values and Standard Deviations
In this section, the performance of each parameter of all the groups altogether is diagrammatically represented in the form of graphs. Mean values (markers) and standard deviation (bars) of each group in every testing date are shown in each graph. Moreover, the term (i.e. linear, squared, cubic or quadratic) by which the graphs were significant is given after each illustration.
Flexibility
The initial flexibility was superior in GRP4, while that of the other three groups was approximately the same. This difference persisted for the first month of the study, but in the subsequent two months, the trends started converging towards each other until on the fourth testing date the mean values were very much the same (25.767, 25.800, 25.250 and 26.188 for GRP1, GRP2, GRP3 and GRP4 respectively). Similar results endured up to the consequent testing date.
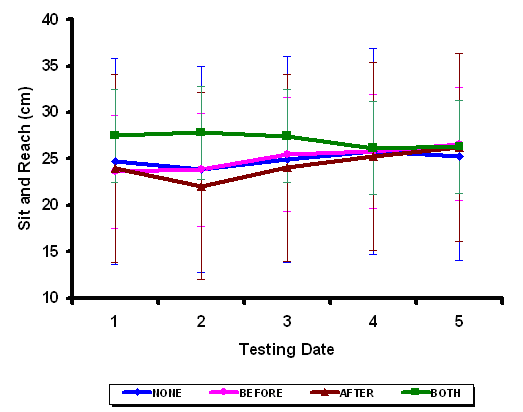
Graphical representation of the mean values (markers) and the
standard deviation (bars) obtained in the SAR test. This difference in graphs
becomes significant when taken in cubic terms (p= 0.0281).
Balance
In terms of balance, GRP1 and GRP4 remained at the same level throughout the five testing dates. There was a slight degradation in performance occurring only on the second testing date. On the other hand, the balance of GRP2 and GRP3 showed constant improvement throughout the 18 weeks. Here again, all groups seemed to be converging towards the same point. However, in this case, this property was more pronounced in GRP2, GRP3 and GRP4.
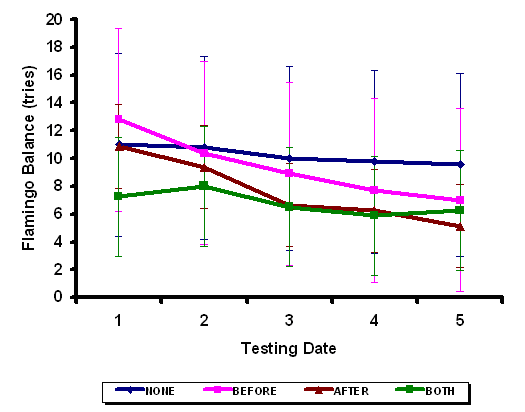
Graphical representation of the mean values (markers) and
standard deviations (bars) obtained in the FLB test. This difference in the
graphs is significant if taken in linear terms (p= 0.0073).
Explosive power
Once again, the performance of GRP1 in the Standing Broad Jump test was relatively levelled while all the other groups showed some improvement at one point or another. GRP3 showed improvement initially; GRP2 improved in the middle part of the study while GRP4 boosted up later on. However, no trends were noticeable in any of the four groups. The latter three groups all exhibited an increase in jump performance of approximately 10 centimetres from T1 to T5 while GRP1 ended up with just 0.67 centimetres improvement by the end of the study.
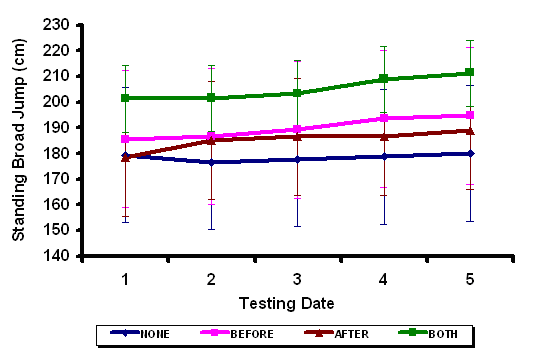
Graphical representation of the mean values (markers) and
standard deviations (bars) obtained in the SBJ test. There is a significant
difference if the plots are taken in linear terms (p= 0.0346).
Coordination
As opposed to the previous parameters, a clear trend of improvement in coordination was only noticeable in GRP1, while that of the other groups remained relatively constant. Although this group started at a distant point, it was very close to the other three groups by the end of the study.
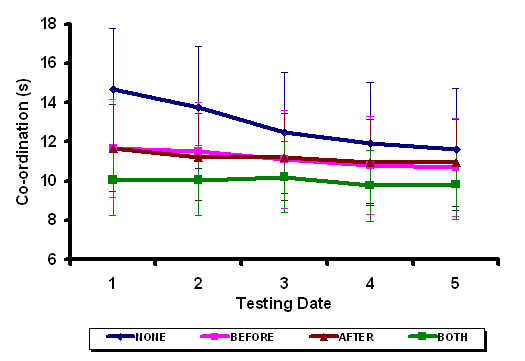
Graphical representation of the mean values (markers) and
standard deviations (bars) obtained in the COB test. There is a significant
difference if the plots are taken in linear terms (p= 0.0059).
Speed
GRP1 showed a trend of constant improvement throughout the 18 weeks with an enhancement of 0.4111 seconds from the first testing date to the last one. Such improvement is quite impressive in a 60-metre run since that would contribute to an upturn of 4.45%. The performance of the other three groups was rather fluctuating with several ascents and descents within the testing period.
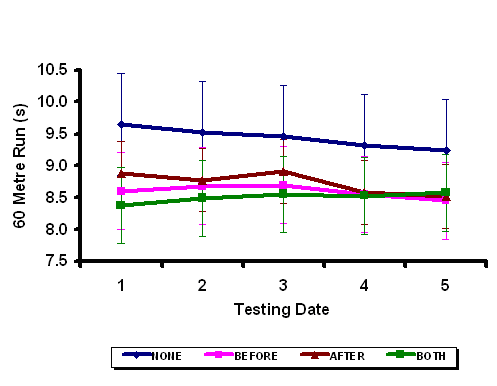
Graphical representation of the mean values (markers) and
standard deviations (bars) obtained in the 60M test. There is a significant
difference if the plots are taken in quadratic terms (p= 0.0279).
Agility
In all of the four groups, fluctuations in agility occurred in the initial stages of the study but then seemed to have levelled off in the last two months. On the second testing date, GRP1, GRP3 and GRP4 showed a sort of a kink in their plot while GRP2 showed a constant rise in the level of agility in the first three months of the investigation.
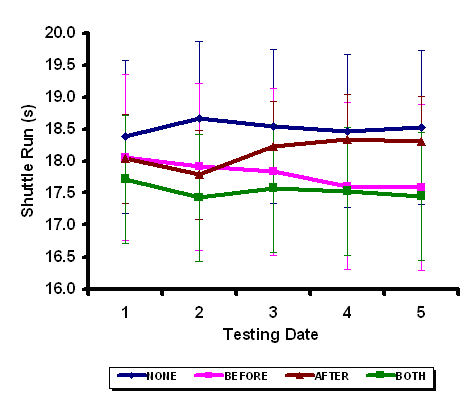
Graphical representation of the mean values (markers) and
standard deviations (bars) obtained in the SHR test. There is no significance
whatsoever in whichever term the graphs are taken.
Endurance
All groups exhibited an enhancement in endurance by the end of the study. GRP1, GRP3 and GRP4 showed a constant rise while GRP2 only showed one boost, which occurred between the third and fourth testing dates. In terms of endurance, GRP3 started with the worst times (along with GRP1) and ended up with the best timing (along with GRP2). This shows that this group made the best improvement overall.
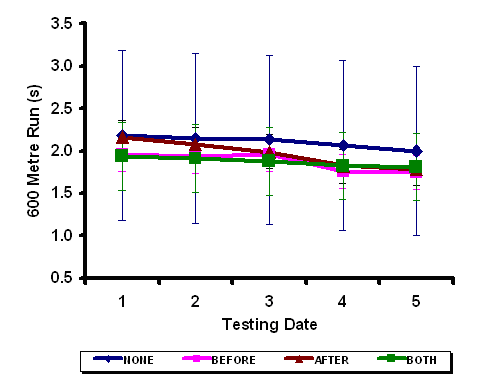
Graphical representation of the mean values (markers) and
standard deviations (bars) obtained in the 600m test. There is a significant
difference if the plots are taken linearly (p= 0.0003).
Within-group Variation
When the data presented in the previous section was analysed further, it was found that change was a common factor for all groups in every motor factor. However, not all changes were significant enough to fall within the 95% confidence limit. Since there was a large amount of data, it was ideal to point out solely the significant values. In each sub-section, a table will summarize what was found significant when using the Wilcoxon signed-ranks test.
Group 1
| Parameter | Change Occurred between | N | Difference | T | p Value | ||
| Test Date No | Test Date No | Largest Value | No of Occasions | ||||
| Coordination | 1 | 2 | 9 | 1>2 | 6 | 3.5 | 0.0241 |
| Coordination | 4 | 5 | 9 | 4 > 5 | 7 | 6.0 | 0.0498 |
| Coordination | 1 | 3 | 9 | 1 > 3 | 7 | 3.0 | 0.0209 |
| Endurance | 1 | 2 | 9 | 1 > 2 | 8 | 2.0 | 0.0156 |
| Endurance | 4 | 5 | 8 | 4 > 5 | 7 | 1.5 | 0.0234 |
| Endurance | 1 | 3 | 8 | 1 > 3 | 7 | 1.0 | 0.0156 |
| Endurance | 1 | 5 | 9 | 1 > 5 | 8 | 5.0 | 0.0380 |
Significant changes were observed in GRP1 in any of the parameters throughout the four months (p value = probability of the results being due to random error; N = number of matched subjects with a non-zero difference; T = total of ranks with less frequent sign).
Group 2
| Parameter | Change Occurred between | N | Difference | T | p Value | ||
| Test Date No | Test Date No | Largest Value | No of Occasions | ||||
| Flexibility | 2 | 3 | 9 | 2 < 3 | 9 | 0.0 | 0.0039 |
| Balance | 1 | 3 | 10 | 4 > 5 | 6 | 8.0 | 0.0461 |
| Speed | 4 | 5 | 6 | 4 > 5 | 6 | 0.0 | 0.0313 |
| Speed | 3 | 5 | 8 | 3 > 5 | 6 | 3.0 | 0.0391 |
Significant changes were observed in GRP2 in any of the parameters throughout the four months (p value = probability of the results being due to random error; N = number of matched subjects with a non-zero difference; T = total of ranks with less frequent sign).
Group 3
| Parameter | Change Occurred between | N | Difference | T | p Value | ||
| Test Date No | Test Date No | Largest Value | No of Occasions | ||||
| Flexibility | 2 | 3 | 8 | 2 < 3 | 8 | 0.0 | 0.0078 |
| Flexibility | 4 | 5 | 8 | 4 < 5 | 7 | 1.5 | 0.0234 |
| Balance | 2 | 3 | 6 | 2 > 3 | 6 | 0.0 | 0.0313 |
| Balance | 1 | 3 | 6 | 1 > 3 | 6 | 0.0 | 0.0313 |
| Balance | 1 | 5 | 7 | 1 > 5 | 7 | 0.0 | 0.0156 |
| Speed | 3 | 4 | 8 | 3 > 4 | 7 | 2.0 | 0.0234 |
| Speed | 3 | 5 | 8 | 3 > 5 | 7 | 3.0 | 0.0391 |
| Endurance | 1 | 2 | 8 | 1 > 2 | 7 | 3.0 | 0.0391 |
| Endurance | 2 | 3 | 8 | 2 > 3 | 7 | 2.0 | 0.0313 |
| Endurance | 4 | 5 | 8 | 4 > 5 | 7 | 1.0 | 0.0156 |
| Endurance | 1 | 3 | 8 | 1 > 3 | 7 | 1.0 | 0.0156 |
| Endurance | 1 | 5 | 8 | 1 > 5 | 8 | 0.0 | 0.0156 |
Significant changes were observed in GRP3 in any of the parameters throughout the four months (p value = probability of the results being due to random error; N = number of matched subjects with a non-zero difference; T = total of ranks with less frequent sign).
Group 4
| Parameter | Change Occurred between | N | Difference | T | p Value | ||
| Test Date No | Test Date No | Largest Value | No of Occasions | ||||
| Explosive Power | 3 | 4 | 8 | 3 < 4 | 7 | 2.0 | 0.0233 |
| Endurance | 3 | 4 | 8 | 3 > 4 | 7 | 2.5 | 0.0313 |
| Endurance | 3 | 5 | 8 | 3 > 5 | 5 | 3.0 | 0.0391 |
Significant changes were observed in GRP1 in any of the parameters throughout the four months (p value = probability of the results being due to random error; N = number of matched subjects with a non-zero difference; T = total of ranks with less frequent sign).
Inter-group Relationships
The values provided by the Wilcoxon signed-ranks test, compare only inter-test-date performance within a group. However, the same change could be common to all groups, thus implying that the change occurred due to another factor (e.g. training program) rather than the different timing of the stretching regime. Hence, a one-way Analysis of Variance (ANOVA) with repeated measures was used to denote significant inter-group relationships. Here again, non-significant values were discarded.
Flexibility
The main flexibility discrepancy occurred between T3 and T4 where the tail probability was as low as 0.0265. Interestingly enough, the change seen by GRP3 was superior to the rest of the groups, while the change seen in GRP4 was poor. The difference between GRP3 and GRP4 was significant, especially between T3 and T4 and also to some extent between T3 and T5. All of the values mentioned are shown in the table below.
| Groups matched | Change occurred between: | p value | Type of Variance | ||
| Most Improved | Least Improved | Test Date No | Test Date No | ||
| GRP1 | GRP4 | 3 | 4 | 0.0150 | Pooled |
| GRP3 | GRP2 | 3 | 4 | 0.0500 | Pooled |
| GRP3 | GRP4 | 3 | 4 | 0.0050 | Pooled |
| GRP3 | GRP4 | 3 | 5 | 0.0333 | Pooled |
Balance
Balance seemed to improve quite similarly between the four groups. However, one significant difference emerged. The separate variance was significant between GRP3 and GRP4 between T4 and T5, with the improvement for GRP3 being the greater one (p = 0.0115).
Coordination
The coordination of GRP1 was highly augmented throughout the four months. The variation found in this group was always superior to the others, but between T2 and T3, T4 and T5 and T1 and T5, it was significantly greater than GRP4. Between T1 and T3, GRP1 was better than all of the other groups. Moreover, the tail probability between T1 and T3 was relatively significant (p = 0.0333).
| Groups matched | Change occurred between: | p value | Type of Variance | ||
| Most Improved | Least Improved | Test Date No | Test Date No | ||
| GRP1 | GRP4 | 2 | 3 | 0.0459 | Pooled |
| GRP1 | GRP4 | 4 | 5 | 0.0394 | Separate |
| GRP1 | GRP2 | 1 | 3 | 0.0395 | Pooled |
| GRP1 | GRP3 | 1 | 3 | 0.0346 | Pooled |
| GRP1 | GRP4 | 1 | 3 | 0.0059 | Pooled |
| GRP1 | GRP4 | 1 | 3 | 0.0226 | Separate |
| GRP1 | GRP4 | 1 | 5 | 0.0210 | Pooled |
Coordination: Inter-group significance
Speed
In terms of improvement in speed, different groups peaked at different testing dates. However, GRP4 was always the underdog and significant changes were always compared to this group.
| Groups matched | Change occurred between: | p value | Type of Variance | ||
| Most Improved | Least Improved | Test Date No | Test Date No | ||
| GRP3 | GRP4 | 3 | 4 | 0.0339 | Pooled |
| GRP2 | GRP4 | 4 | 5 | 0.0123 | Separate |
| GRP3 | GRP4 | 3 | 5 | 0.0412 | Pooled |
| GRP3 | GRP4 | 3 | 5 | 0.0279 | Separate |
| GRP1 | GRP4 | 1 | 5 | 0.0419 | Pooled |
Speed: Inter-group significance.
It is important to note that no significant inter-group relations could be found in the remaining motor factors.
Analysis of Flexibility Trends (SAR)
The major characteristic seen in this parameter was that all groups seemed to converge towards the same level of flexibility at the end of the 18 weeks, irrespective of the point of initiation and the timing of the stretching regime. This might indicate that training constituents (e.g. plyometric strength versus maximal strength) can have a stronger influence on the degree of flexibility rather than the timing of the stretching. This does not disprove in any way the results obtained by Mc Nair and Stanley (1998), Mallac (2000), Kubo et al. (2001), and Auburn University (1986) as cited in Anderson (2000). Note that, in these studies, the subjects followed only a stretching regime and no other form of training during the investigation. Therefore, stretching was the major component of their training schedule, while in this study, stretching was just one part of a more complex training program. Therefore, in the latter case, the effects of stretching could have been masked by stronger training components. Considering the training schedule provided to the athletes involved, the time spent on stretching (20 minutes if before or after only; 40 minutes if both before and after) was only a small amount (26.92%) of the total time (135 minutes) of the whole session.
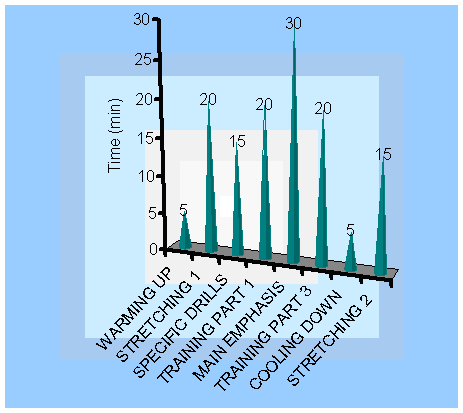
Time allocated to each component of each training session.
The significant changes noted earlier on were only between neighbouring testing dates. Thus, no significant changes were obtained right through the study. Such differences cannot be taken as reliable information since they were absent in the remaining periods of the investigation. Moreover, these variations could have been influenced by other factors (e.g. injuries, motivation, etc.), thus making them less reliable. This indicates that the common diversion towards the same point of flexibility occurred at a gradual, constant pace. This property continues to strengthen the assumption that stronger training components mask the effects of differentiating the timing of stretching.
Analysis of Balance Trends (FLB)
The trends obtained in balance were very much comparable to those obtained in flexibility. This could mean that flexibility and balance are interdependent; that is, a change in either one of these two elements will probably cause the same change in the other. Since flexibility levels were not greatly affected by the different timing of the stretching protocol, the levels of balance were not affected as well. Exception for GRP1, all of the groups seemed to converge towards the same point and by the end of the study, the levels of balance were pretty much comparable.
However, in contrast to flexibility, significant improvements in balance were obtained in the two groups. GRP2 showed a substantial balance advancement between T1 and T3 (p=0.0461) while GRP3 exhibited an even larger enhancement between T1 and T3 (p=0.0313) and T1 and T5 (p=0.0156). As opposed to the results obtained in flexibility, these improvements are noteworthy and must be taken into consideration. It is important to note, however, that these alterations still occurred in parallel with those reported in flexibility. Thus, this might further indicate that although flexibility and balance are interdependent when changes occur, they will be more pronounced in the case of balance.
Finally, no significant inter-group relations were obtained. Once again, this result is equivalent to that obtained in flexibility. Unfortunately, no studies have been carried out in this field to which these results can be compared. However, these results can shed new light on the relationship between flexibility and balance parameters.
Analysis of Explosive Power Trends (SBJ)
Despite the vast amount of literature debating the effect of flexibility on explosive power (Ettema, Huijing and de Haan, 1992; Fowles and Sale, 1997; Avela, Kyrolainen and Komi 1999; Grantham, 2000; Fowles, Sale and Mc Dougall, 2000; Rosenbaum and Hennig, 1995; Takarada, Yusuke Ishige et al, 1997; Kubo, Kawakami and Fakunaga, 1999), no significant relationship could be detected in this study. The only substantial change was seen in GRP4 between T3 and T4 (p=0.0233). However, such a value could have been obtained by chance when considering the remaining number of results, which were far from significant. Holder-Powell and Rutherford (1999) could also find no significant relationship and therefore, these results are congruent with their findings.
It is important to note, however, that all of the groups who stretched at some point or another, finally ended up with an increase in performance (by approximately 10 cm). On the other hand, the control group showed only a minimal improvement. Although this was not statistically significant, these results might indicate that if this part of the study is performed with a larger sample, some significant values might emerge.
Analysis of coordination Trends (COB)
Improvement in coordination was completely dominated by GRP1. The coordination of this group advanced drastically between several testing dates, and the change was still statistically significant between T1 and T3 (p=0.0209). Although enhancement in coordination persisted even beyond T3, the change was not large enough to be significant between T3 and T5 and consequently T1 and T5.
The boost in coordination seen in GRP1 was significantly superior to the change noted in all the other groups between T1 and T3. However, when considering the whole 18-week period, GRP1 was only substantially superior to GRP4 (p=0.0210).
These results suggest that stretching might hinder coordination performance irrelevant of the timing of a training session. This statement is further strengthened by the fact that GRP4, which spent the most time stretching, finally ended up with the least improvement in coordination. On the other hand, this argument is still debatable since no literature could be found to which these results can be compared.
Analysis of Speed Trends (60M)
The trends obtained in speed were very similar to those obtained in coordination. This implies that a direct relationship might also exist between coordination and speed. Although the graphs of these two parameters appear to be similar, the changes seen in GRP1 were not statistically significant. Substantially significant advancements were only noted in GRP2 and GRP3 between T3 and T5.
On the other hand, GRP1 showed the same trend as that exhibited in coordination. Furthermore, the improvement displayed by this group was again statistically significant over GRP4 throughout the 18 weeks (p=0.0419). In this case, the change observed in GRP3 between T3 and T5 was also considerably superior to that noted in GRP4 (0.0412). Similar to what was perceived in coordination, GRP4 was once again the group to show the least improvement in speed.
Therefore, these results indicate that stretching, at any time given within a training session, might pose a negative effect on speed performance, possibly in a similar way to how stretching affects coordination. The negative relationship between flexibility and speed obtained through these findings is incongruent with the findings made by Yamashita, Ishii and Oota (1992).
Analysis of Agility Trends (SHR)
No significant relationship could be drawn from this study between the different timing of stretching and agility. Additionally, the graphical representation of the trends of agility was the only diagram that developed no significant connection in whichever term it was analysed. Furthermore, no literature could be found regarding whether stretching or flexibility influences the level of agility. This might, therefore, indicate that differentiating the timing of the stretching regime has no significant effect on agility.
Analysis of Endurance Trends (600)
Improvement in endurance was common to all groups. GRP1, GRP3 and GRP4 showed constant improvement in endurance while the performance of GRP2 boosted only between T3 and T4. This was the only group that reported no significant improvements. The greatest level of improvement was observed in GRP3, which started with the worst times and ended up in front with the best times. GRP1 and GRP3 advanced significantly between T1 and T5 (0.0380 and 0.0156 respectively) and GRP4 only registered a substantial endurance enhancement between T3 and T5 (0.0391).
In spite of this, no significant inter-group relationships were reported. This implies that the significant changes seen throughout the study were attributed to external factors rather than the different timing of the stretching regimes. Since these tests were carried out during the pre-season phase, where most of the aerobic work takes place, the type of training was most probably one of these dominant factors. Therefore, this builds upon the conclusions made by Gleim et al. (1990), as cited in Sharp (2000), as it suggests that, although not significant enough, post-exercise will produce a sharper rise in endurance when compared to other timing-of-stretching possibilities.
Influencing Factors
Injuries were the most influencing factors throughout the study. The rate of injury and the time out of training required for each injury varied between the four groups.
Although the monitoring of injuries was never the aim of the study, it was still ideal to make a note of them as they might have interfered with the athlete's performance during the testing procedure. Interestingly enough, GRP2 had the highest rate of injury and the largest total time out of training. This goes against conventional research (Thompson, 1991; Jones and Barker, 1996; Appleton, 1998, Norris, 1993, Tabrizi et al. 2000), which states that pre-exercise stretching lowers the risk of injury. On the other hand, these results complement other studies such as Gleim and Mc Hugh (1997), Shrier (1999), Lally (1994) Pope, Herbert and Kirwan (2000) Pope, Herbert, Kirwan and Graham (2000) and Voorn et al. (1993), which reject the traditional approach to stretching. Note, however, that this group comprised the largest number of subjects and therefore had a higher probability of injury occurrence.
| Month | Group | Number of Injuries | Percentage of total injuries | Total time out of training |
| Total | GRP1 | 2 | 20% | 5 days |
| GRP2 | 6 | 60% | 45 days | |
| GRP3 | 1 | 10% | 3 days | |
| GRP4 | 1 | 10% | 7 days |
Total number and percentage of injuries per group and the total time out of training required.
GRP3 had the lowest percentage of injury (10%) and the least total days out of training (3). These results are consistent with the findings and comments produced by Borer, Edington & White (1983), Appleton (1998) and Lally (1994), which imply that post-exercise stretching is more capable of reducing the risk of injury. Amongst the reasons postulated were improved rate of transport of amino acids into muscle cells, accelerated protein synthesis, inhibition of protein degradation and alignment of collagen according to the lines of stress, thus aiding recovery and regeneration.
Fortunately, all of the athletes had recovered on the testing dates, and so they were able to carry out the tests. However, psychological setbacks resulting from the injury itself might still have been present on the testing date. A considerable change in anthropometric properties would have been a second highly influencing factor. However, by monitoring the body mass index, it could be seen that there were no sudden changes in weight-to-height relations. Additionally, the changes seen between one testing date and another were analysed, but no significant values were deducted.
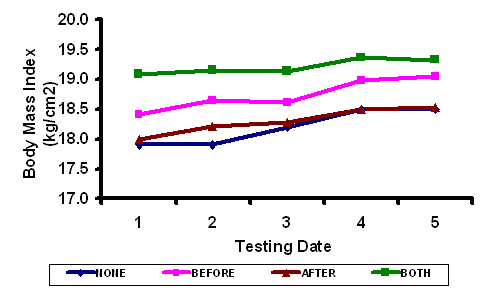
Body mass index- the trends observed throughout the study
As reported by Renson (1987) cited in the Council of Europe (1993), the FLB test requires a lot of concentration. Therefore, the results could have also been affected by the differing potential of concentration in the subjects. Additionally, the SHR and 600 tests could have been affected by a lack of motivation due to the severity of the tests.
Limitations and Recommendations
A sample of 40 subjects (from which 5 athletes dropped out) was too small for such a study to obtain substantially significant results. Although some significant trends were obtained, many other quotients were in the region of 10% significance, using a larger sample, these results could have gone into the 95% confidence limits and become statistically significant as well. Thus, carrying out the same study with a larger sample will produce a clearer trend of results.
Another limitation would be that this study investigated only 12 to 16-year-old athletes. Since, this is a specific growth spurt area (i.e. puberty) the same results cannot be generalized and employed on a younger or older age group as some of the results are prone to change, especially those of flexibility. Therefore, other studies must be carried out to observe if similar trends emerge in different age groups.
Implications
First, the findings suggest that differentiating the timing of a stretching regime may produce a substantially significant result in individuals whose training load is minimal. However, in individuals such as the subjects tested in this study, this effect could have been masked by more dominant training components. Furthermore, the results of stretching differ according to the specific requirements of the event itself. In this study, it was found that while stretching before exercise should ameliorate balance and flexibility, it could impede endurance. In contrast, post-exercise stretching can improve balance and flexibility without having any specific effect on any aerobic parameter. This indicates that middle to long-distance athletes will benefit if they cut down from pre-exercise stretching and concentrate more on post-exercise stretching.
On the other hand, sprinters, hurdlers, jumpers and throwers who require mainly speed, explosive power and some element of balance and flexibility, will benefit more from post-exercise stretching.
Coordination seemed improved only in GRP1, thus indicating that stretching poses a negative effect on this parameter. However, there is no specific athletic event that requires mainly coordination. Therefore, coordination can be reckoned as a secondary requirement, where other factors become more important. Moreover, the level of coordination in the other three groups was high enough for the athletes to work with.
It is important to note that injury prevention comes before improving performance. Considering that GRP3 had the least amount of injuries and the minimum time out of training, it would, therefore, add up to choosing post-exercise stretching as the best protocol for overall fitness.
Conclusion
For quite some time, there has been an ongoing debate on whether stretching should be done before or after exercise to prevent injuries and maximize performance. Other studies have even questioned the real significance of stretching. However, most of these studies were carried out under standardized or laboratory conditions.
But what about the specific meaning of stretching in the field of play? Is it needed? And if it is needed, where should it be carried out, before exercise, after exercise or even both before and after exercise? This two-tailed hypothesis was investigated by using well-endorsed fitness tests. The data was then processed using tables, graphs and statistical packages (Wilcoxon signed-ranks test and ANOVA).
The results obtained suggest that a stretching protocol should be included in the training program. The ideal timing in which to include this stretching protocol is after the training session because the benefits of post-exercise stretching seem to outweigh those of pre-exercise stretching. Although one might think that combining these two will gain benefits from both, analysis of the results obtained indicated that stretching both before and after physical training tended to hamper performance in most of the parameters tested.
It is important to note that stretching was not introduced to improve performance, but it was also meant to serve as a mechanism for injury prevention. This is the reason why the studies regarding stretching and injury prevention were also analysed in the literature review. During the study itself, injury occurrence was monitored but this was not detailed enough to attribute to the relationship between stretching and prevention of injury. This factor was monitored to check if the incidence was substantial enough to affect the results produced.
Recommendations for further research would be to reproduce such an investigation with a larger sample and nonetheless involve athletes of different age groups and different sports. It would also seem beneficial to repeat the studies that were mentioned in the literature review but this time involving all training components and not just stretching.
Such variance might have a dissimilar outcome. Traditionally, stretching was done after warming up before the exercise block. However, this study confirms the recent recommendations whereby stretching is undertaken towards the end of the training session. Apart from preventing unnecessary injuries, further studies in this field can contribute to elevating sports performance to a higher level.
Page Reference
If you quote information from this page in your work, then the reference for this page is:
- CALLEJ, L. (2004) Pre & Post Exercise Stretching [WWW] Available from: https://www.brianmac.co.uk/stretchpaper.htm [Accessed